 United Kingdom - English
 United States - English
 Ireland - English
 Netherlands - Dutch
 France - French
 Germany - German
 Italy - Italian
 Spain - Spanish
 Belgium - Dutch
 Portugal - Portuguese
 Singapore - English
 Malaysia - English
 Australia - English
 New Zealand - English
Trip history – Kinesis Pro user guide
Review every journey your vehicles have made. See highlights such as the distance a vehicle has travelled, the number of journeys made and the total drive time for a specific reporting period.
Table of content
2. Events
Watch the video below or scroll down for step-by-step instructions.

1. Visual Trip Data
1.1 Introduction
Trip Data is available per Asset, per day.
This is available at various points on the platform in various forms, as outlined below.
Trips are created from the telemetry data of the Device, and require the following as a minimum:
- Ignition on and off,
- Change in GPS position, with an increase in the odometer value of the Asset.
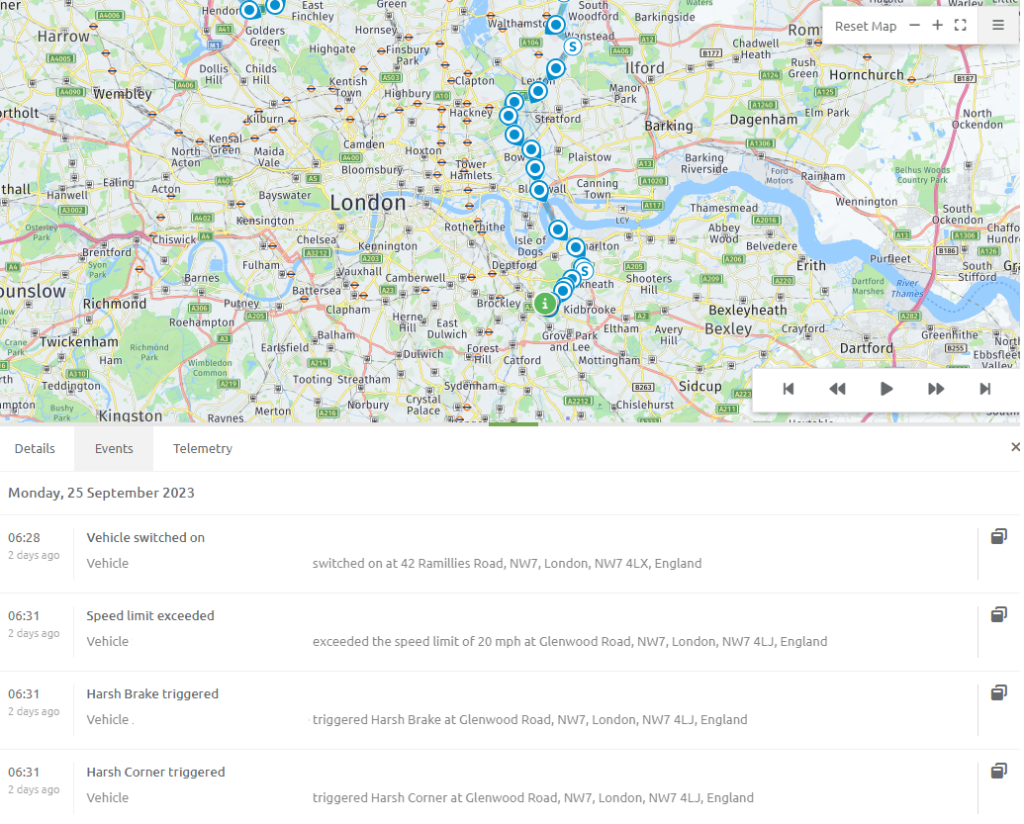
Trips are displayed in a visual form based on the above, and each data point from the device creates a position on the map. Other useful information is included in the visual Trip data, such as when the trip started and ended, the average speed during the trip etc. Below is an overview of the information displayed per trip in the Trip Replay section of the platform:
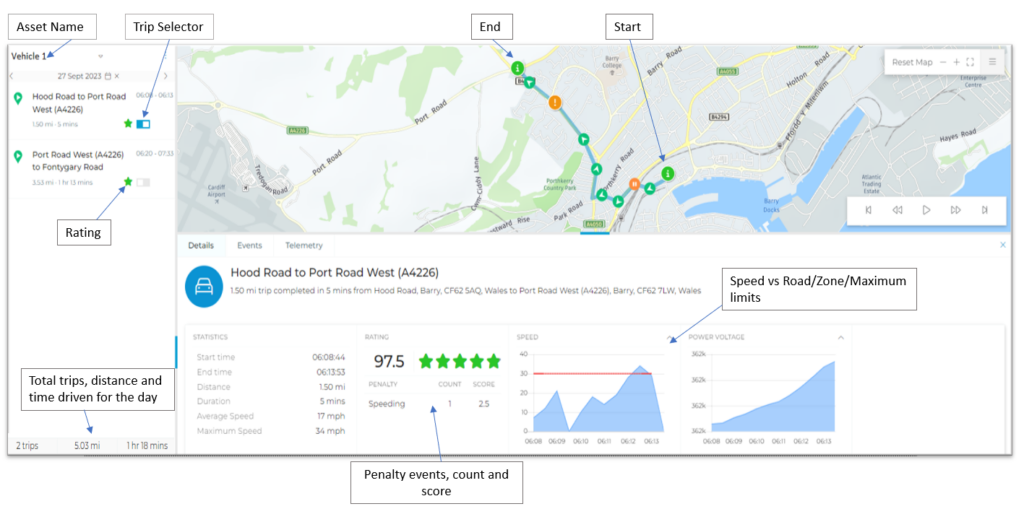
Besides the trip Details, there are also tabs for the Events and Telemetry for that trip. Each of those items are explained separately.
Trips appear in two places on the platform:
- Live Map section
- Trip History section
1.2 Trip History Section
To see an Assets’ trips, Choose the Trip History option from the menu:
Then select an Asset from the drop-down option.
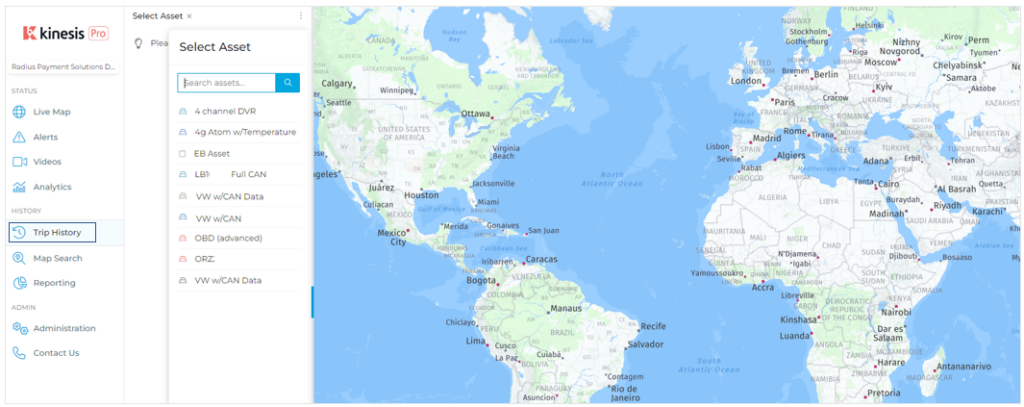
The trips for that Asset will appear for today’s date.
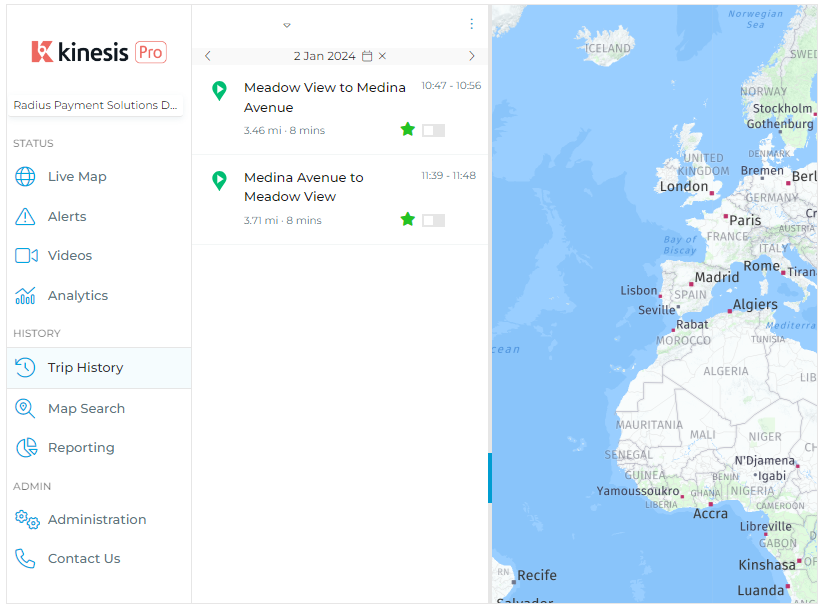
Change the date and Asset as needed, and choose the relevant trip from the list, to visualise that data.
1.3 Overview Section
To see an Assets’ trips,
1. Choose the Asset from the list,
2. Click on the Trip under the Activity feed to open it in a new pop-up
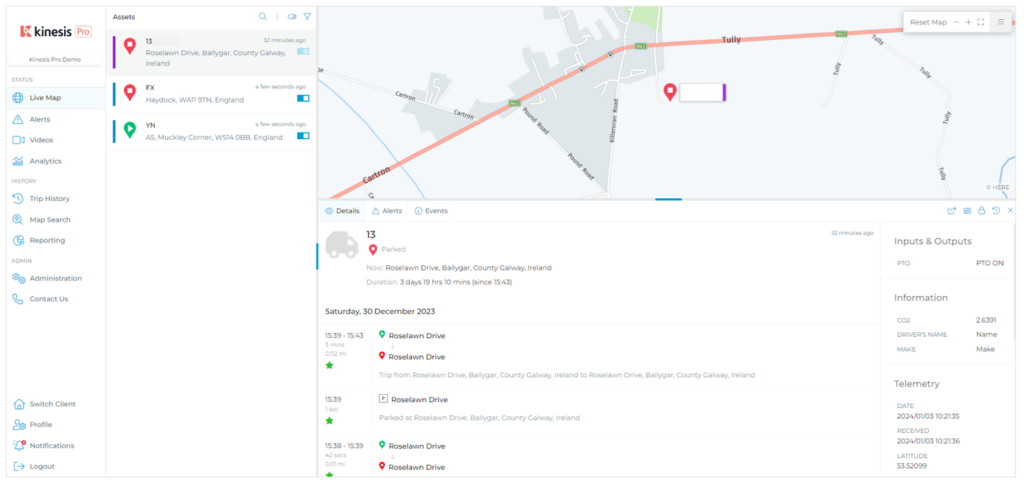
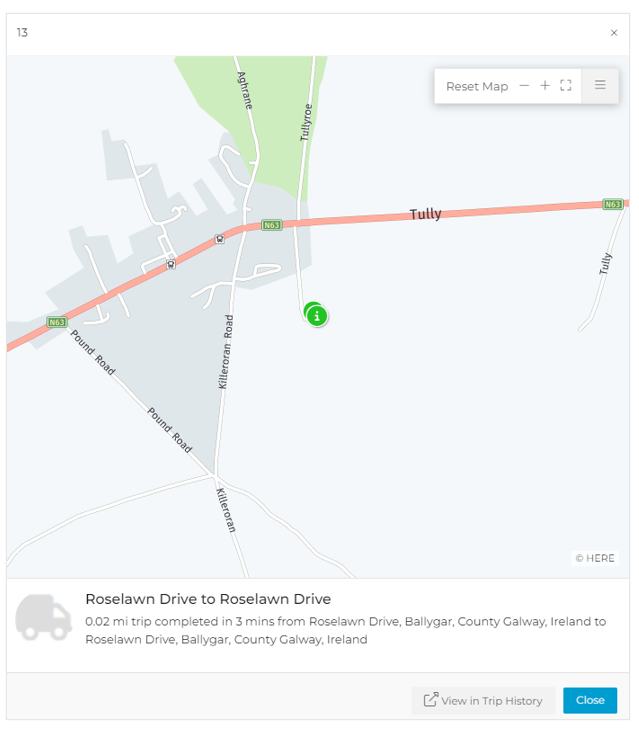
If you would like to see more details of the opened Trip, choose the View in Trip History icon in the bottom right corner of the pop-up window.
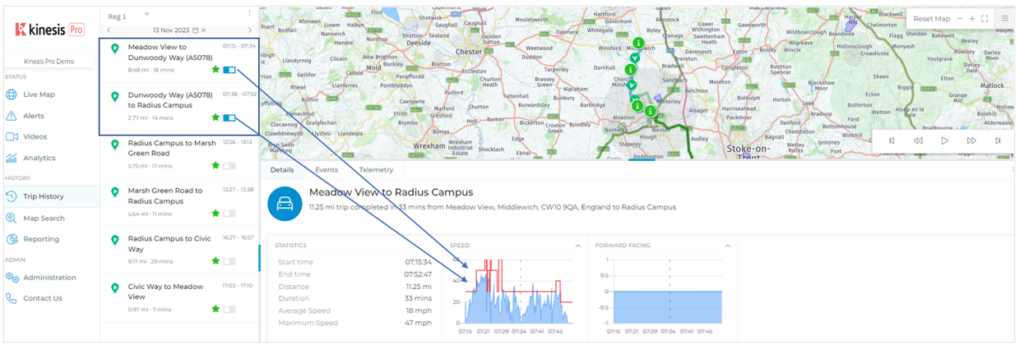
1.4 Viewing Multiple Trips
To see multiple trips on the map, use the “checkboxes” to choose multiple trips. The trips will display on the map as well as joining the telemetry data, and showing all Events for the time frame in question.
In the example below, two trips are chosen. The map displays the trails for each, and the telemetry data is linked, with the dotted lines showing where the link is made:
2. Events
2.1 Introduction
Multiple events can occur during a trip, from speeding, entering and leaving locations etc. The way trips are displayed, as well as the data grouped, helps the User quickly identify what and where these events occurred.
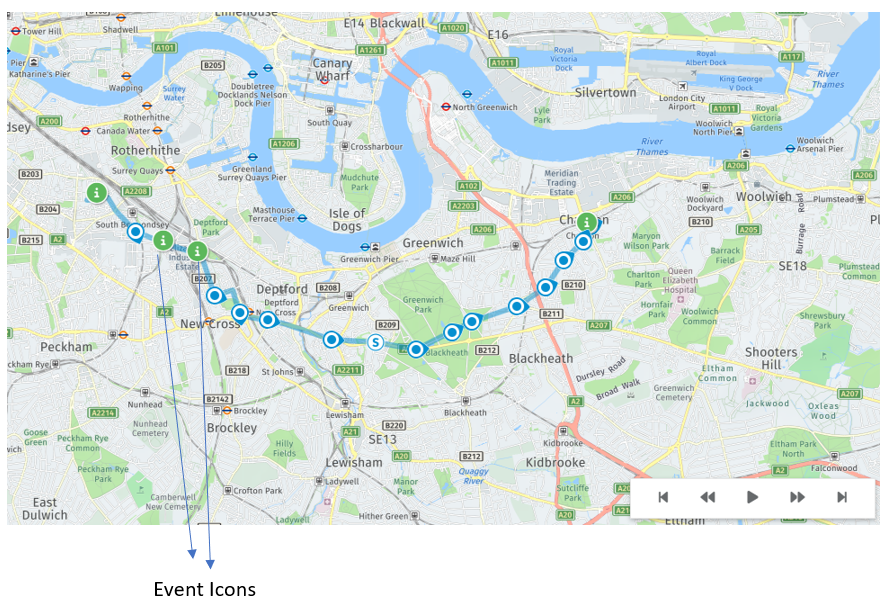
2.2 Visual Display
When a trip is displayed, icons appear on the map in the position of a specific Event. If an Event has been used to create an Alert, the Alert will display as an icon as well:
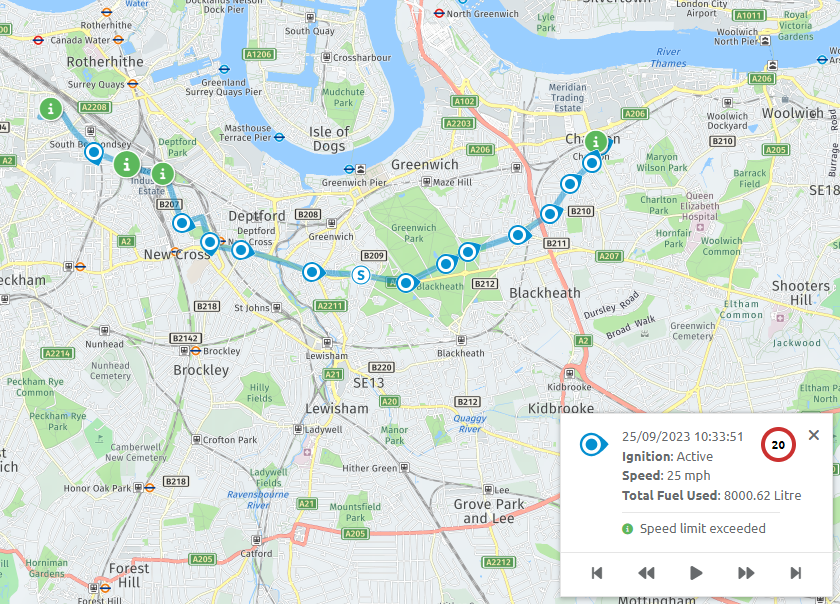
Clicking an Event icon generates a pop up with the information for that data point:
2.3 Listed events
The Events for a trip are also displayed in a list under the Events tab
Clicking the

Opens a new pop-up window icon shows the Event in isolation on the map
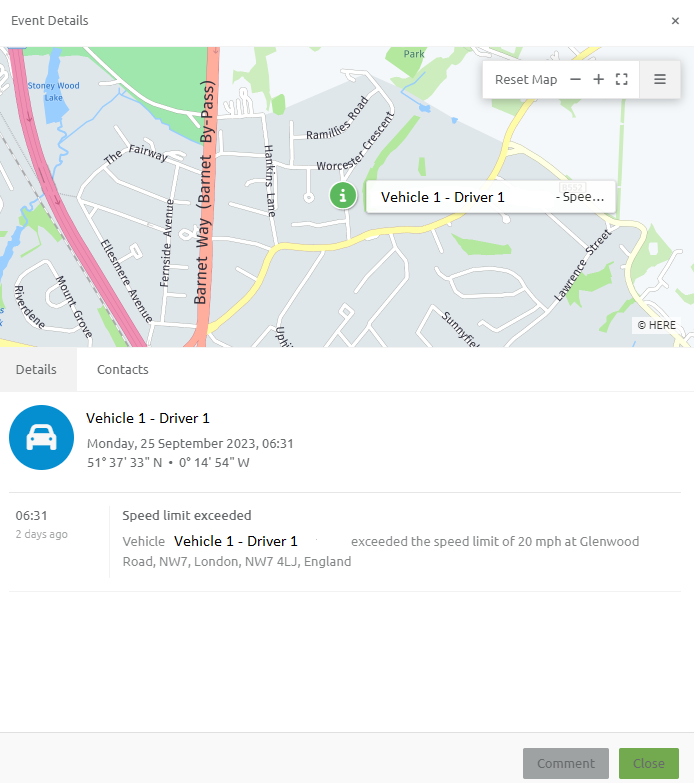
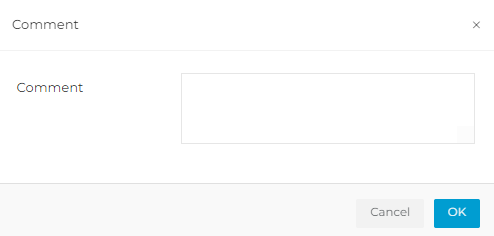
Users can comment on the Event.
2.4 Reporting
There are numerous reports that can be generated from Events, specific to an Asset, a day, or multiple Assets and days:
1. Alert Report – lists Alerts generated from Events
2. Events Report – lists Assets and Events that have occurred,
3. Over speeding – specifically shows over speeding Events,
3. Excessive Idling – reports on excessive idling Events,
4. Digital Events – reports on any instances where the digital inputs have been triggered,
Keep learning
Need help?
Use our help me choose wizard or contact us on one of the options below.