 United Kingdom - English
 United States - English
 Ireland - English
 Netherlands - Dutch
 France - French
 Germany - German
 Italy - Italian
 Spain - Spanish
 Belgium - Dutch
 Portugal - Portuguese
 Singapore - English
 Malaysia - English
 Australia - English
 New Zealand - English
Analytics (dashboards) – Kinesis Pro user guide
Kinesis Pro comes with a standard report, but adding custom reports and seeing insights on your dashboard is configurable using rule sets. It’s easy to set up and highly powerful.
Table of content
1. Overview
3. Filtering Data on a Chart Widget
5. Sharing Chart Widgets to another Dashboard
6. An Introduction to Creating Dashboards
7. Creating Standalone Dashboards
1. Overview
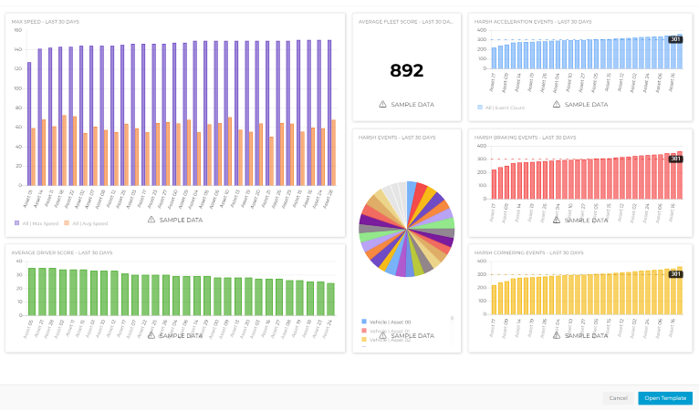
You should have two of our most popular dashboards preloaded onto your account – a Driver Performance Dashboard and a Vehicle Utilisation Dashboard. If you would like more, please reach out to your account manager or customer service.
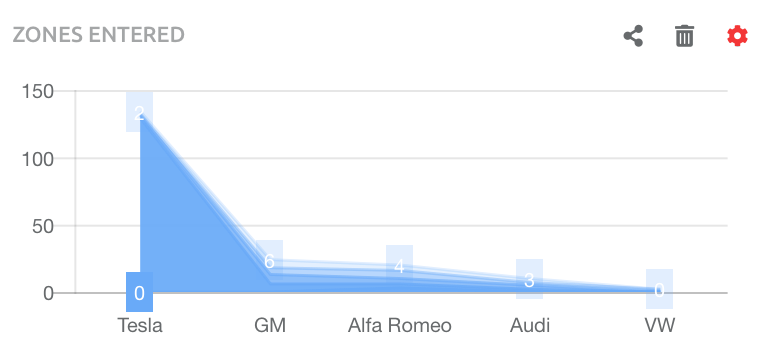
Examples of Dashboard Charts
2. Editing Widgets
Introduction
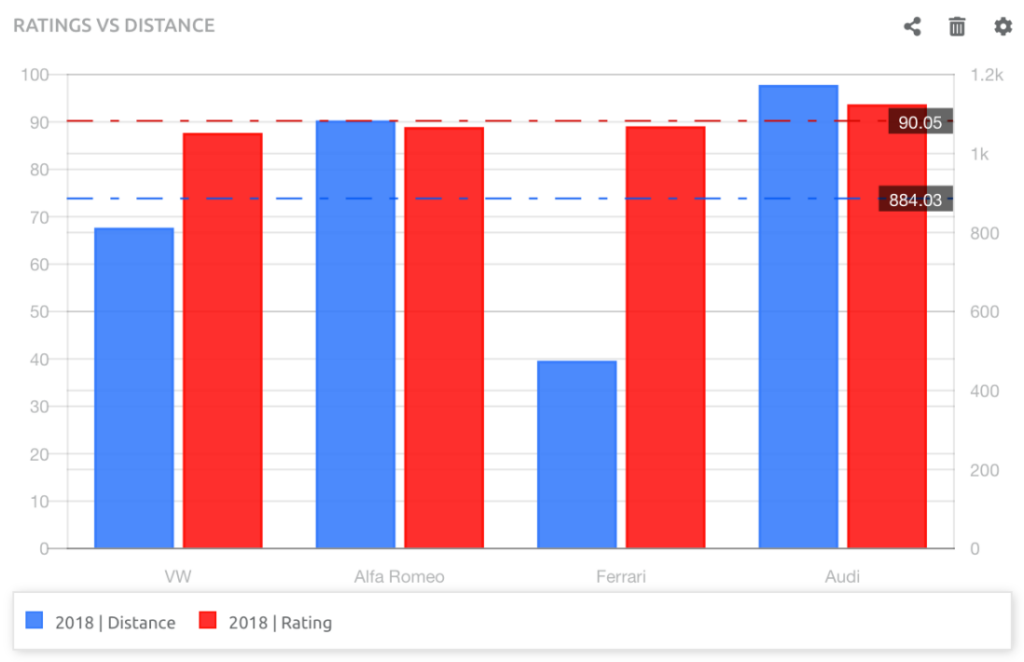
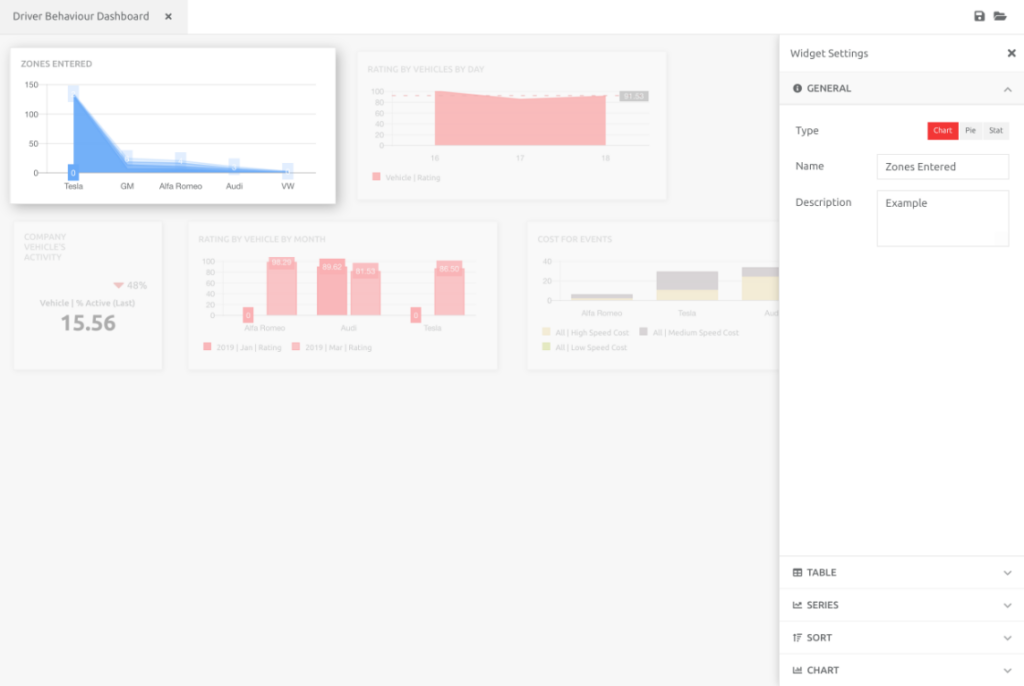
Widgets on the Dashboard can be edited directly on the Dashboard. This includes the type of chart, the data series, and all the editable features found when running an Analytics Report. They can also be shared to more than one Dashboard and deleted.
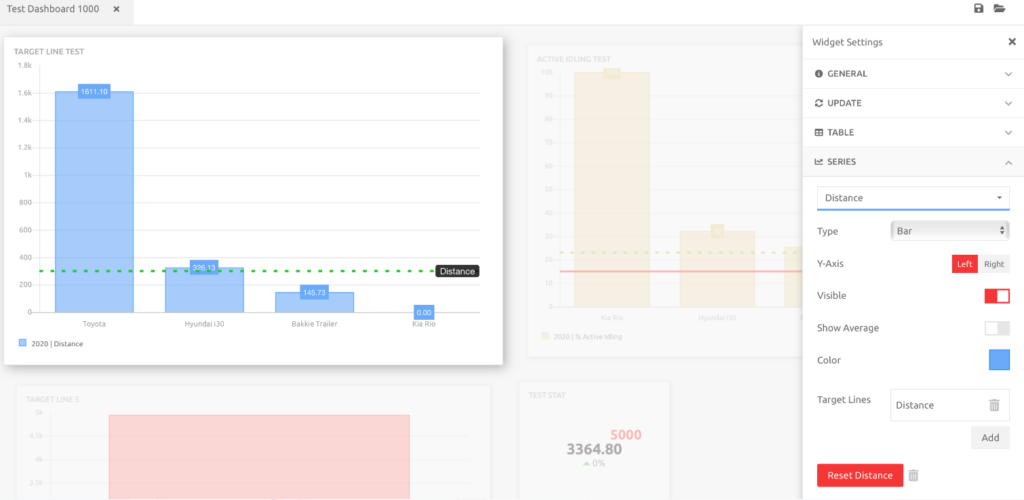
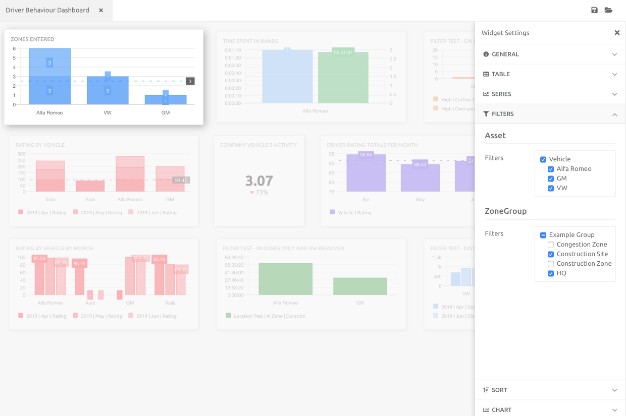
A full set of tools opens on the right-hand side of the screen, where editing takes place. This includes changing the chart type to a different Widget and all other parameters. In this example, the chart Series has been changed to a bar chart, adding the average line and a target line or two. To pull the changes through, close the tools by clicking the X:
3. Filtering Data on a Chart Widget
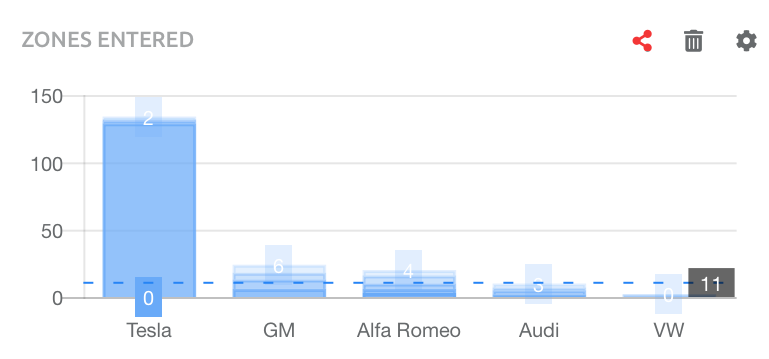
To filter data on a Chart Widget, navigate to the Filter section. The Filters available are as per those data fields chosen in the Rows and Columns of the report. In the example below, Rows were Assets, and Columns were Zone Groups:
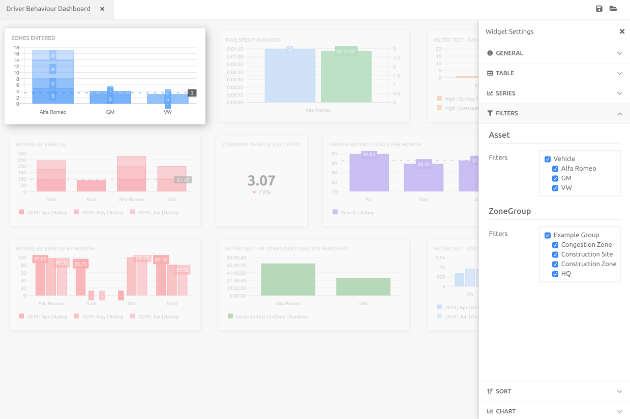
In the screenshot below, two Zones have been filtered out of the data set. Choose the items to keep in, and remove from the data set, then close the tool section by clicking the X:
4. Deleting Chart Widgets
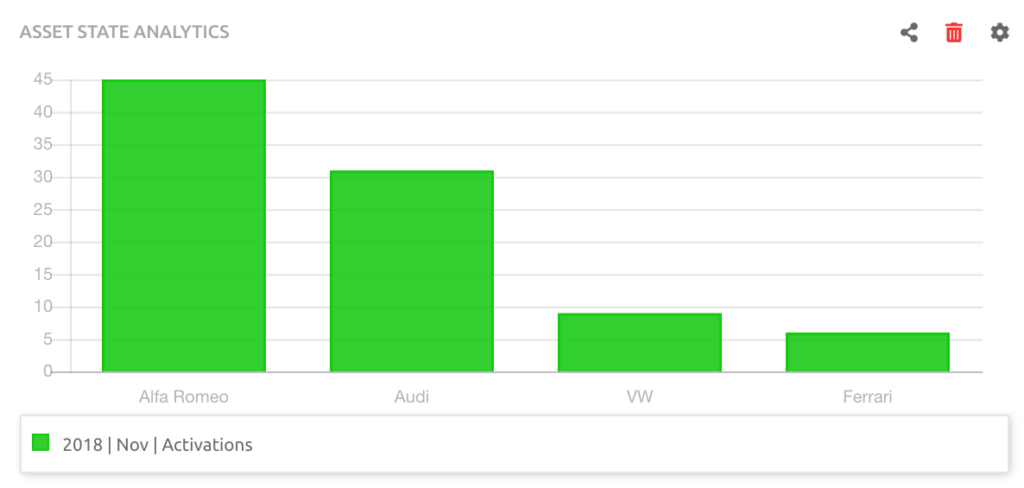
To delete a Chart Widget, choose the delete button:
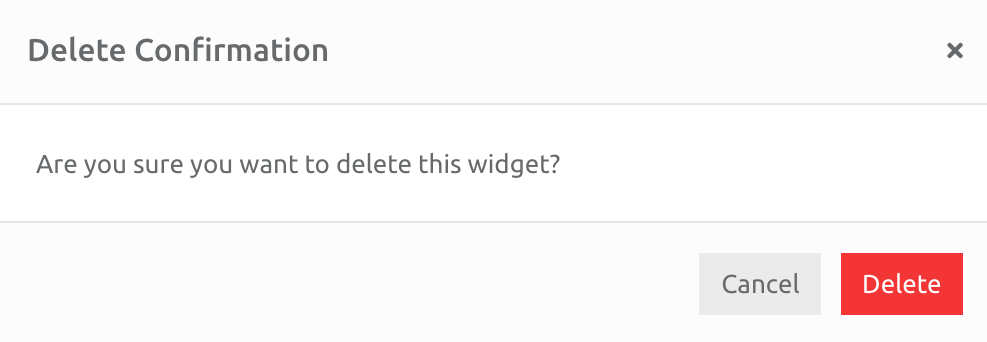
A confirmation pop-up box will appear:
5. Sharing Chart Widgets to another Dashboard
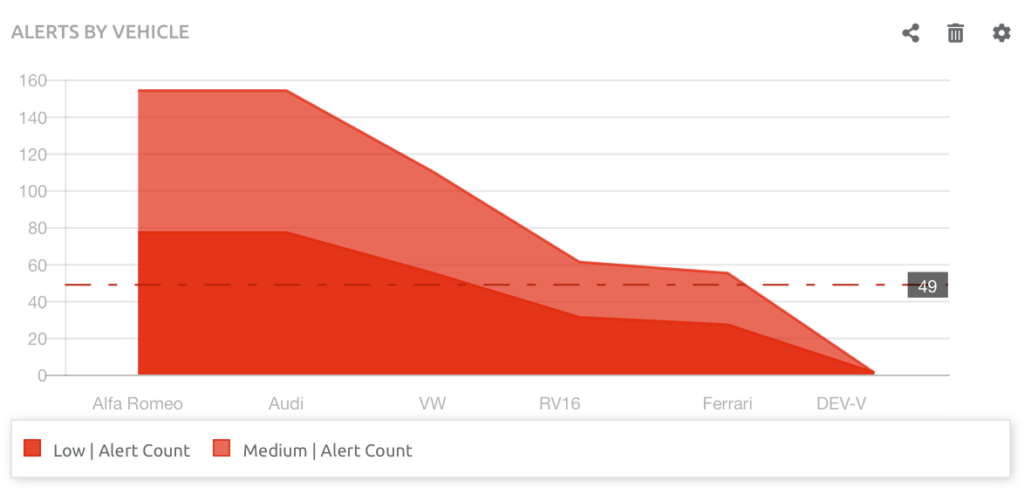
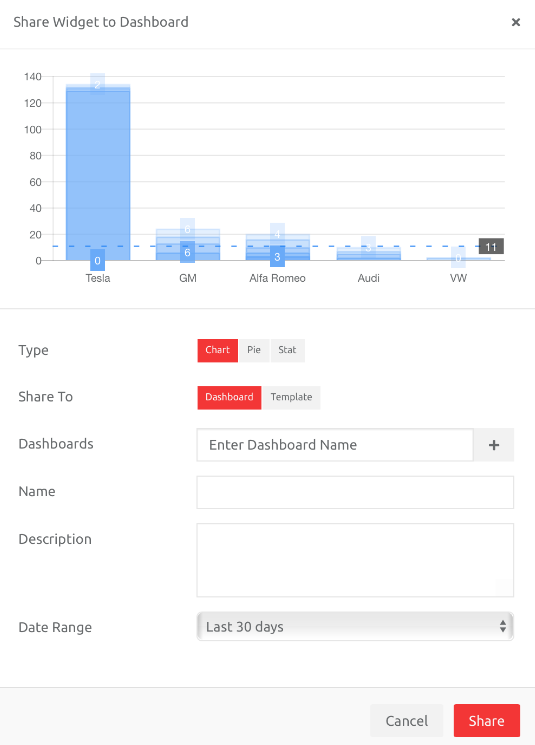
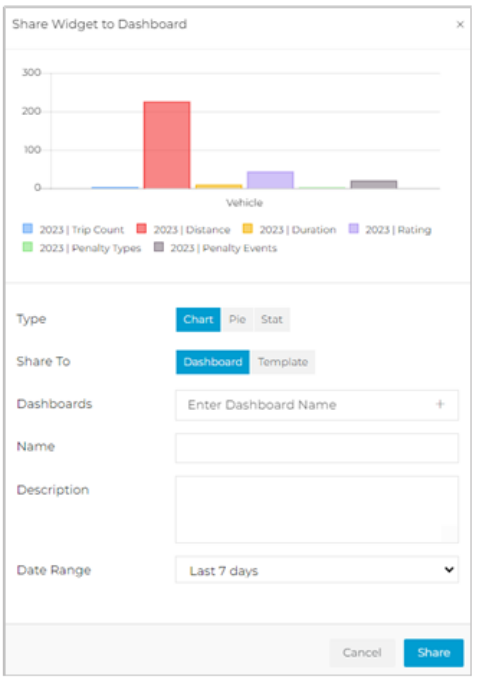
To share a Chart Widget with another Dashboard, choose the share button:
A confirmation pop-up box will appear, which needs to be completed. Choose the Dashboard or Template to share the Chart Widget to, as well as change the Name and Description:
6. An Introduction to Creating Dashboards
Dashboards are placeholders for Widgets which are created from Analytics Reports.
If a Dashboard is created from a blank template, it needs to be populated with data. If a Dashboard is created from a Template (created from another Dashboard), then data populates automatically. Analytics Dashboards can be created as Stand Alone items or as Templates that everyone can use.
The process flow for creating each type of Dashboard is explained below.
Dashboards are User specific. Each User opens their own choice of Dashboard.
Stand Alone
Users create a Dashboard >> populate with data >> this is created on the account.
This option is useful to display certain data specific to an individual account (e.g. Zone entry and Exits or number of Alert commented on).
Dashboards can be restricted to a Cost Centre, users in each Cost Centre will see their respective Dashboards.
Templates
Templates have been created and made Public >> all Users can open this Dashboard, and the data will populate for Assets on an account.
Opening a Dashboard Template will automatically update with each Client’s data.
Important facts about Dashboard Templates:
- Templates are created and made public by Kinesis Pro Administrators at Radius Telematics
- If a Dashboard is created from a Template, the Dashboard is locked – nothing created from the original template can be edited by any User. Other Widgets can be added to this Dashboard by Users.
- The Dashboard can be cloned (if the User has the rights to create Analytics Dashboards and Reports). If cloned, this new Dashboard can be edited and other Widgets added to it.
7. Creating Standalone Dashboards
Standalone Dashboard are useful if you want to display a lot of data specific to your account.
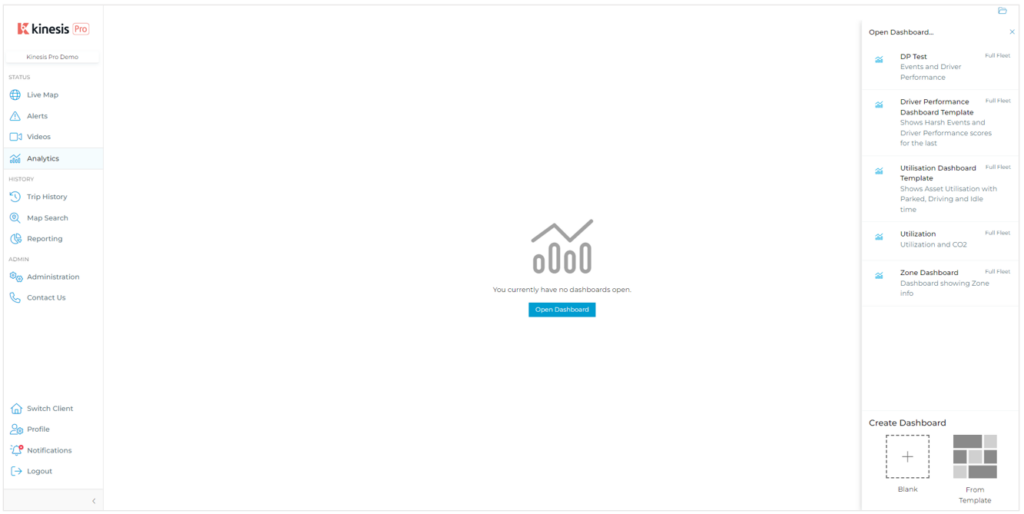
Go to Analytics.
A message will display, to Open Dashboard, Click this button.
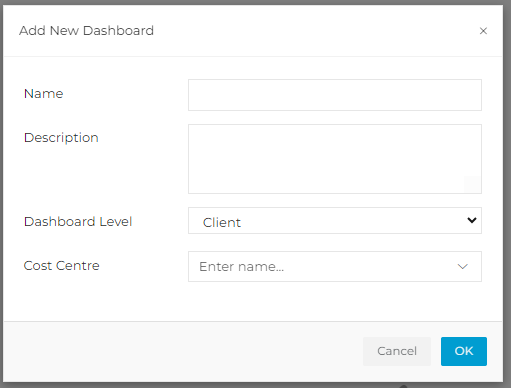
A menu screen will appear on the right-hand side, and unless Dashboards have been created previously, will be blank. Choose the Blank option under Create Dashboard.
The Dashboard will open, and will display a message saying there are no widgets on the Dashboard. To create widgets, click Open Reports.
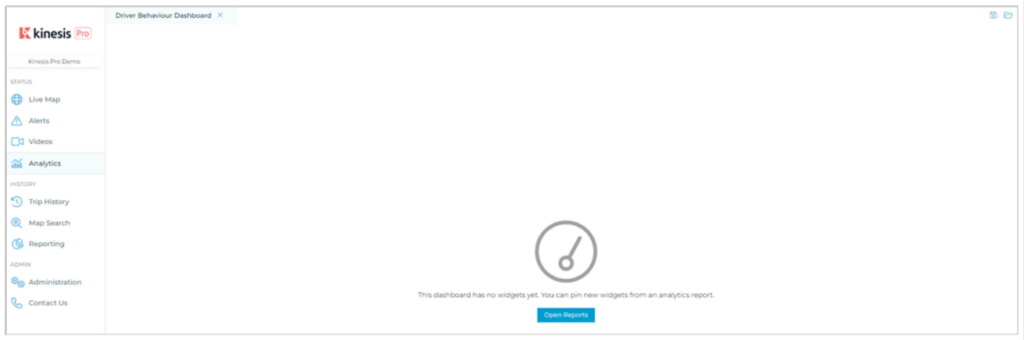
This will take you to the Reporting section of the platform, where Analytics Reports can be run, and the widget data shared to the Dashboard.
Keep learning
Need help?
Use our help me choose wizard or contact us on one of the options below.